Abstract
As urban areas grow, predicting public transportation usage is essential for sustainable city planning and efficient resource allocation. This paper explores the development of a digital twin system for the Istanbul metro network, designed to predict usage patterns by analyzing smart card transaction data. Using big data technologies, machine learning models, and simulations, the system provides actionable insights for better decision making in public transportation.
The research also seeks to identify missing or corrupted records inside existing open datasets, since data quality sets a hard limit on what any forecasting method can achieve. The approach supports planning in cities like Istanbul, helps meet current transportation demand, and improves the integration of existing infrastructure.
Try the prediction
The forecasting model behind the paper is a GRU and LSTM network that needs TensorFlow, so it cannot run inside this page. What runs below instead is a simple lookup model, fitted on the same training rows the network saw and scored on the same test rows. Pick a station and a day to see the hourly shape it predicts, drawn against what was recorded at that station in August 2024. How it compares with the network is set out further down.
Read the numbers as an illustration of the daily shape rather than as an operational forecast. The sample in this repository covers six well recorded dates, and Monday is not one of them, so the recorded line is missing for Monday and rests on a single date for every other day.
Loading the fitted model.
Counts are passengers entering through that turnstile group in one hour. Stations on the M2 are split into separate north and south records, so a name such as Sisli 2 Kuzey covers one direction of one station rather than the whole station.
Publication
Accepted as Chapter 38 of Advances in Performance Management and Measurement for Industrial Applications and Emerging Domains, edited by Alessandra Cantini et al., in Springer Nature's Lecture Notes in Production Engineering. Print ISBN 978-3-032-26587-6, publisher reference 642849_1_En.
Chapter DOI 10.1007/978-3-032-26588-3_38, book DOI 10.1007/978-3-032-26588-3. Both resolve once Springer Nature publishes the chapter. Page numbers and the publication year follow with the Version of Record.
Method
The pipeline runs from raw smart card transactions through cleaning and feature engineering to a trained sequence model, and from there to prediction, simulation, and operating recommendations.
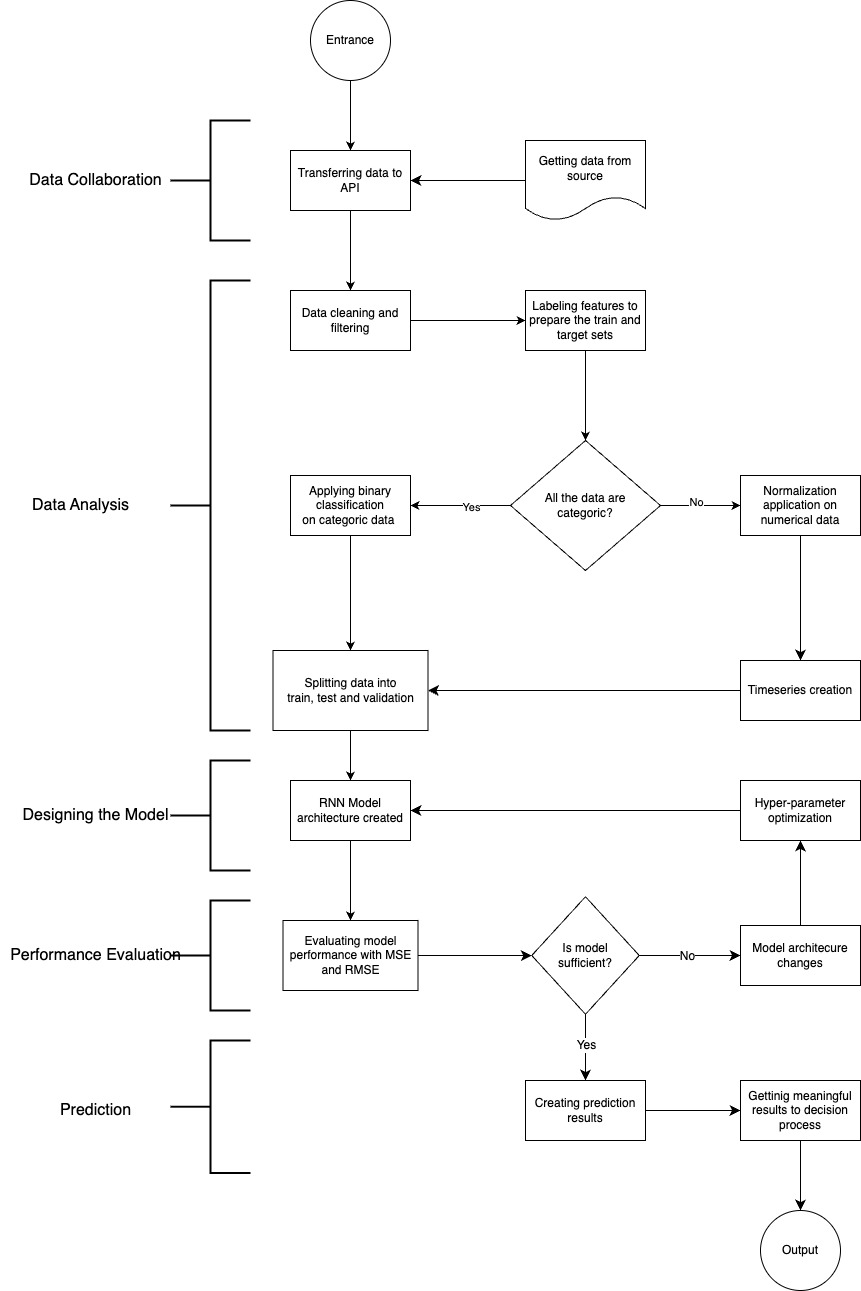
Model inputs combine three groups of features:
- Historical passenger flow sequences at hourly resolution.
- Station specific encodings, since stations differ widely in volume and shape of demand.
- Temporal features such as day of week, holidays, national events, and football match days.
Data
The primary source is smart card transaction data from the Istanbul metro network. Two open datasets from the Istanbul Metropolitan Municipality open data portal were used alongside it:
- Rail system daily, monthly, and yearly line based trip counts (accessed 10 May 2025).
- Daily total rainfall over Istanbul dams, used as auxiliary weather data (accessed 19 May 2025).
- Hourly public transport data set, which is the monthly file the notebook loads directly.
- Additional records were requested through the open data request form.
What the data looks like
- Strong seasonality, with weekday and weekend patterns that differ sharply.
- A clear upward trend in ridership over the observed period.
- Noise from special events and weather conditions.
- Peaks in the morning between 7 and 9 and in the evening between 17 and 19.
Data quality problems
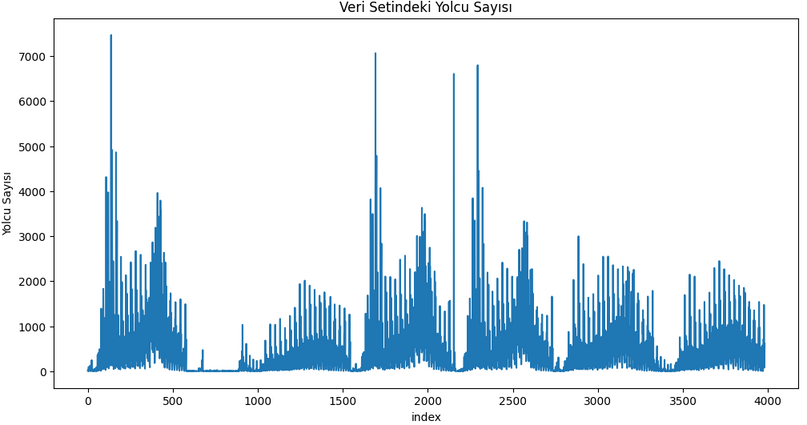
A large part of the work went into finding records that were incomplete or wrong. Transaction logs contained gaps caused by system outages, and several stations showed counter behaviour that could not be explained by real ridership. Plotting the raw series against index and against transition hour made these breaks visible.
What the sample in this repository holds
The file under Dataset/ is a sample of August 2024 rather than the full month, and it is worth being precise about how thin it is. Filtering it to line M2 and transport type 2, then grouping by date, hour and station, leaves 3,982 rows across 29 station records and 31 dates. A complete month would hold 21,576 rows, so 18 percent of the grid is present.
That 18 percent is not spread evenly. Six dates were logged across most of the service day, namely 1, 25, 27, 28, 30 and 31 August. Every other date in the file carries between 9 and 27 rows in total, usually a single hour at a handful of stations, with daily sums as low as 21 passengers across the whole line. Those rows are not real quiet days, they are the gaps the paper set out to find.
Two consequences follow. Monday never appears among the well recorded dates, which is why the model in the section above has nothing to check a Monday prediction against. And the near empty dates stay in the training data, so part of what the network learns to fit is missing records rather than passenger behaviour. Cleaning those rows out before training is the most direct improvement available to this work.
Model
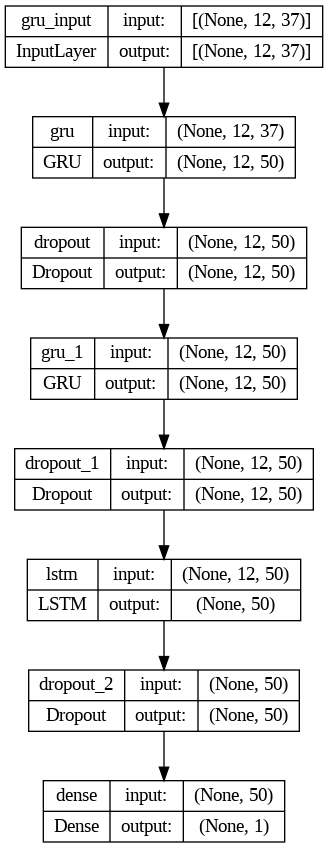
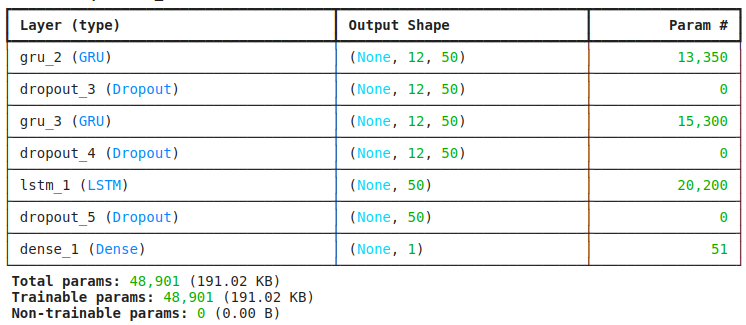
The forecasting model is a stack of two GRU layers followed by an LSTM layer, with dropout between them and a single dense output. It takes a sequence of 12 hourly steps with 37 features and predicts the passenger count for the next step. The network has 48,901 trainable parameters, which is small enough to retrain often as new data arrives.
The data was split 70 percent for training, 15 percent for validation, and 15 percent for testing, giving 2,778 training samples, 595 validation samples, and 596 test samples. The split is random rather than chronological, so windows from across the whole month appear in all three sets.
Results
The figures below come from the training run archived in Metro_Istanbul_Usage_Prediciton.ipynb in this repository.
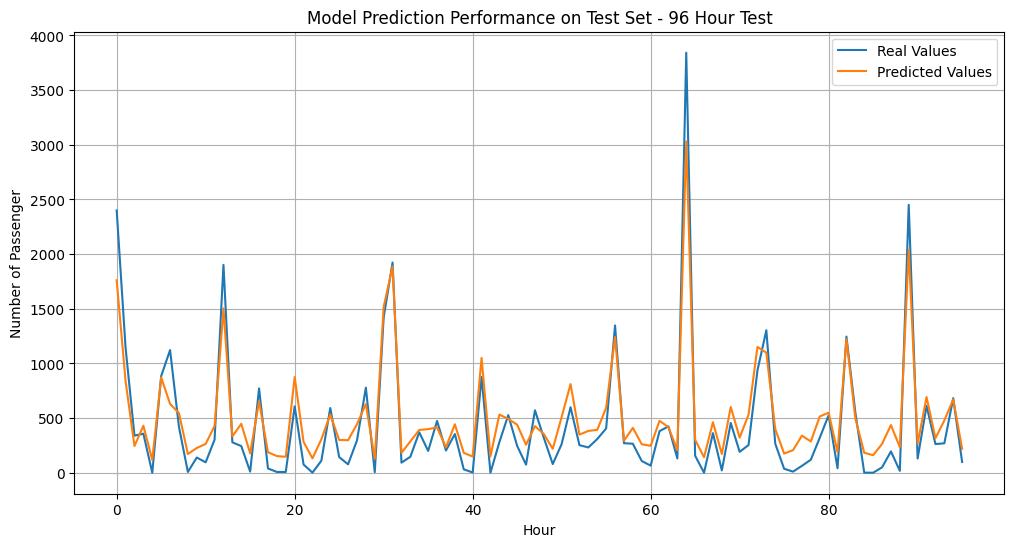
The model tracks the daily shape of demand well, including the timing of both rush hour peaks. It is less accurate on the extremes: the tallest spikes are underestimated, and quiet night hours are overestimated by a few hundred passengers. Both errors follow from training on a squared error loss, which pushes predictions toward the middle of the distribution.
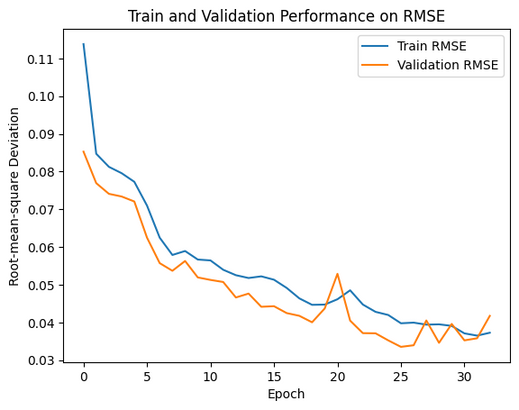
How the network compares
Is the network worth its complexity? To check, a few simple lookup models were fitted on the same training rows and scored on the same 596 test rows, so the figures line up directly. The best of them is the one driving the predictor at the top of this page. Rebuild the table with python3 tools/build_baseline.py.
| Method | RMSE | R squared |
|---|
Two things stand out. Station and hour alone already explain about 70 percent of the variance, which is a reminder that most of the signal in this data is a daily rhythm repeating station by station. Adding a weekday and weekend flag helps, but splitting all the way down to individual days of the week makes the result much worse. Because only six dates in the sample were recorded across the service day, each station, hour and weekday cell rests on a single date, so those averages are mostly noise. The network avoids that trap because it reads a 12 step history rather than a single cell, and it ends up about 27 percent lower on RMSE than the best lookup model here.
Digital twin integration
The forecasting model is one component of a larger digital twin. On its own it produces numbers; the value comes from wiring those numbers into the systems that operators already use.
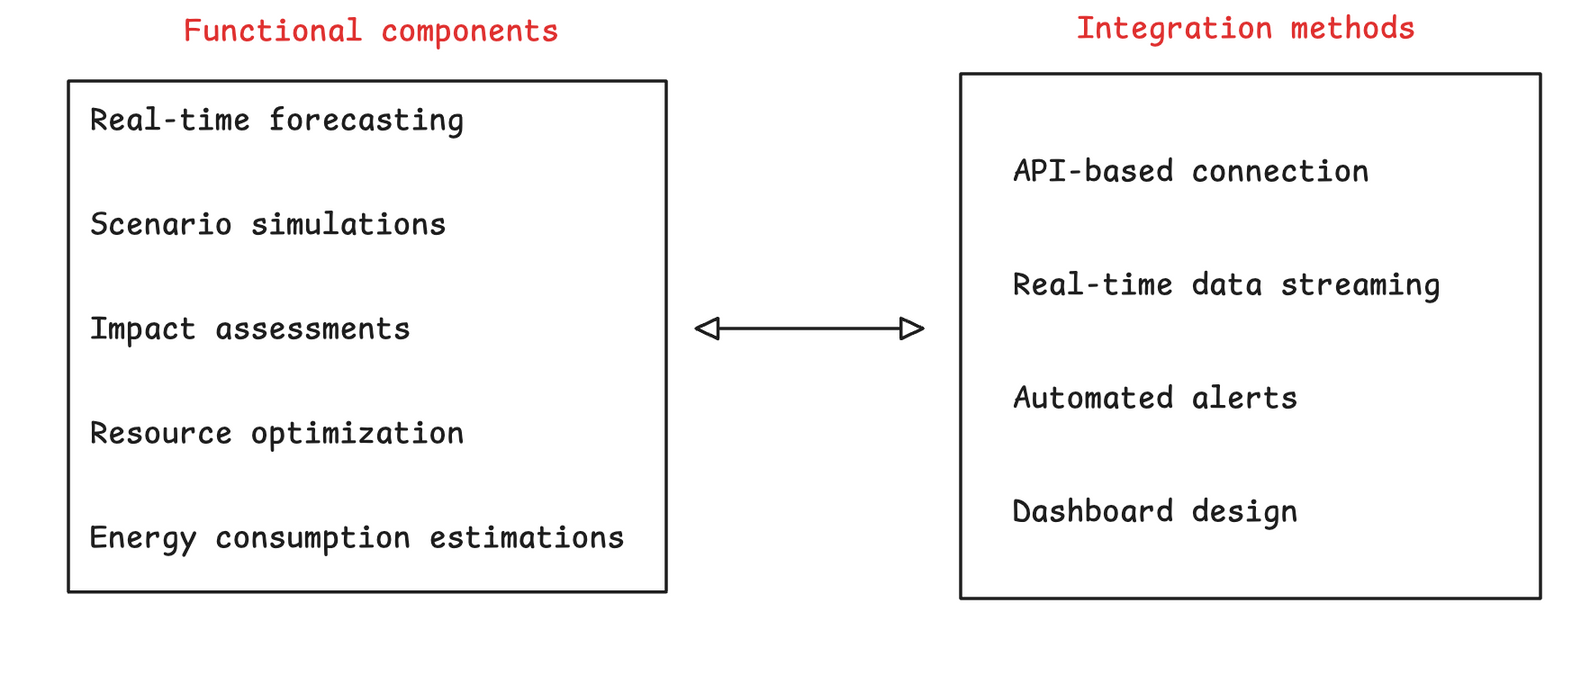
A worked example from the paper: for morning rush hour at central transfer stations, predicting passenger flow 24 hours in advance and raising train frequency by 15 percent over the current schedule gives a 22 percent reduction in average waiting time and an 18 percent decrease in platform congestion.
Limitations and further work
- Data arrives from several institutions in different formats, and joining it is still manual.
- Real time inference across the whole network needs more compute than the current setup provides.
- Older metro lines have no BIM models, so the physical side of the twin is incomplete for them.
- Smart card data carries privacy risk and needs careful aggregation before any wider release.
- Weather and event feeds could be pulled in directly rather than joined after the fact.
- A passenger facing view, either a live map or a mobile app, has not been built.
Running the model
The analysis lives in a single Jupyter notebook and was run on Kaggle. To run it locally:
git clone https://github.com/yasinnerten/graduation-thesis.git
cd graduation-thesis

python3 -m venv venv
source venv/bin/activate

pip install pandas numpy tensorflow scikit-learn matplotlib seaborn jupyter
jupyter notebook Metro_Istanbul_Usage_Prediciton.ipynb
The Dataset folder holds the sample data used by the notebook, and Model_archive keeps earlier notebook versions for reference.
How to cite
Please cite the Version of Record once it is published. Until then:
@incollection{erten_digital_twin_istanbul_metro,
  author    = {Erten, Ahmet Yasin and Cebeci, Ufuk},
  title     = {Developing a Digital Twin System for Predicting Usage of
               Istanbul Metro Lines Using Smart Card Data},
  booktitle = {Advances in Performance Management and Measurement for
               Industrial Applications and Emerging Domains},
  editor    = {Cantini, Alessandra and others},
  series    = {Lecture Notes in Production Engineering},
  chapter   = {38},
  publisher = {Springer Nature Switzerland},
  isbn      = {978-3-032-26587-6},
  doi       = {10.1007/978-3-032-26588-3_38},
  note      = {In press}
}
License
The source code and software in the repository are licensed under the MIT License. See LICENSE.
The research paper and its textual and graphical content are not licensed under the MIT License. Copyright in the research paper remains with its authors, and manuscript sharing is subject to the applicable Springer Nature publishing agreement.
Contact
Questions and collaboration proposals are welcome.
- Email: ertena19@itu.edu.tr
- Website: yasinnerten.com
- GitHub: @yasinnerten
- LinkedIn: linkedin.com/in/yasinnerten
- ORCID: 0009-0004-8837-3596