Given a green area in a dryland region, will it survive — or is it running down a finite water store toward an eventual collapse?
Dryland greening is not always ecological restoration. Vegetation can increase because rainfall recovered, because a restoration programme worked, or because irrigated agriculture is pumping groundwater that will not be replaced.
Telling those apart matters, but it is not the whole question. A region can be unambiguously irrigation-driven and still be either sustaining itself or depleting its water store faster than any snapshot classification would reveal. Satellite vegetation indices look the same in both cases.
So we predict survival directly. Given a location's own multi-year trajectory, is it sustainable, resilient_but_water_dependent, at_risk, or declining? Classifying why an area is green stays in the pipeline, but as validation evidence rather than the headline.
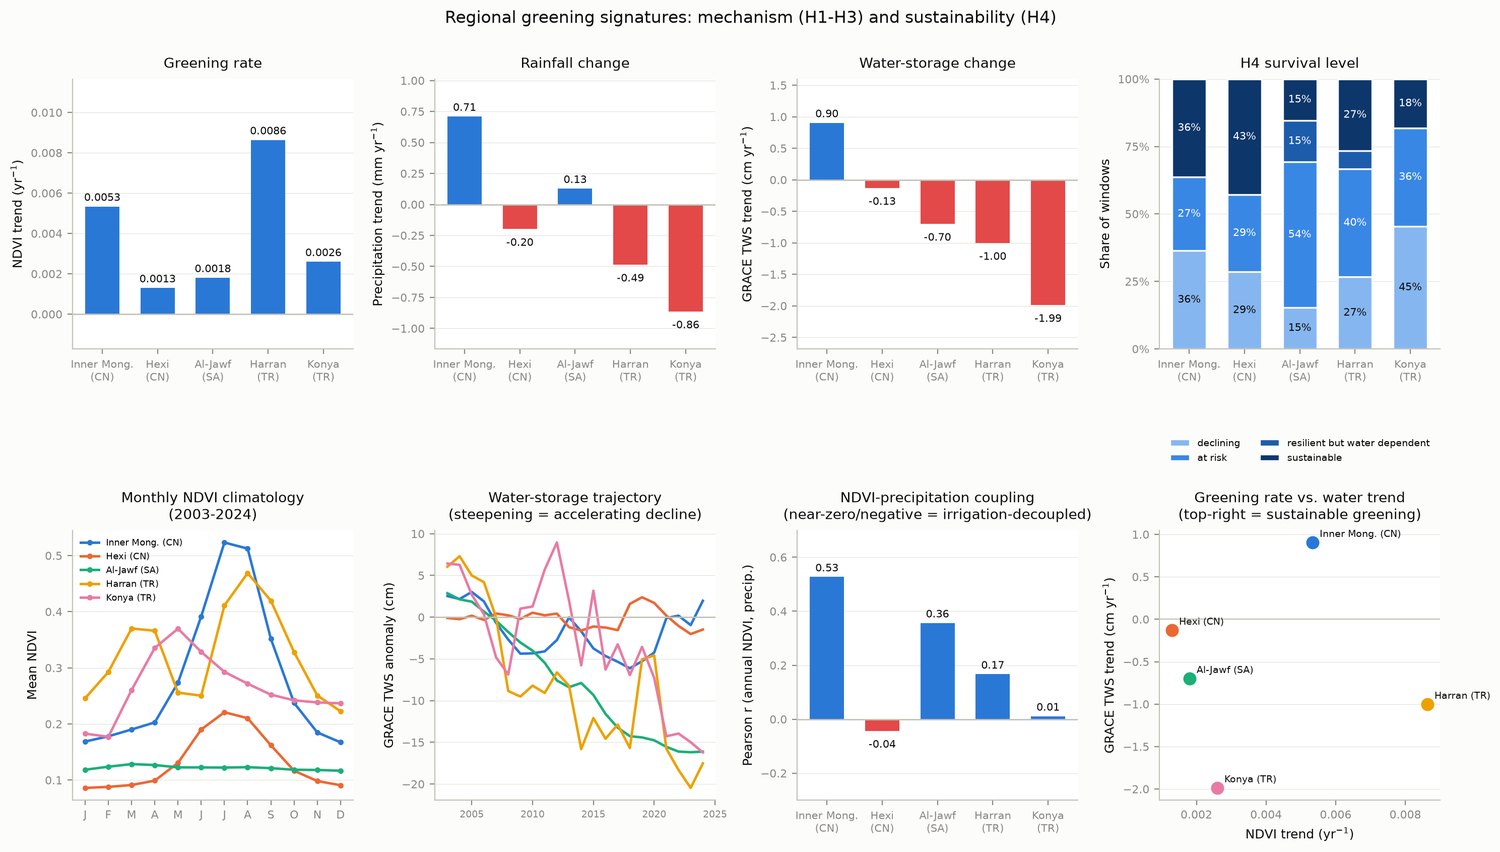
Five drylands chosen so the mechanisms contrast: a verified restoration site, two groundwater-irrigation sites, and two under mixed pressure.
Verified restoration. The only site gaining water storage while greening.
Oasis irrigation against restoration, at a scale regional averaging struggles to separate.
Centre-pivot irrigation in hyper-arid desert, with a matched non-agricultural control.
Climate stress and depletion at once: the study's steepest rainfall decline.
Irrigation development. Fastest-greening site in the dataset.
Four results we think are worth carrying forward, including the two that are inconvenient.
Three-year persistence alone cannot separate restoration from irrigation: Al-Jawf and Harran persist more (68.8%) than confirmed-restoration Inner Mongolia (43.8%).
Adding a trajectory signal — is a site's water decline accelerating against its own long-run average? — resolves it. The class for sites persisting on a non-accelerating deficit is nearly empty: 3 of 80 windows. Nearly every water-dependent persistent window is at_risk instead. The depletion behind these sites is measurably worsening, which a snapshot label cannot show.
Harran greens fastest in the dataset (+0.0086 NDVI/yr) and is among the least sustainable by water trajectory. Inner Mongolia greens slowly and is the only site where water storage is rising (+0.90 cm/yr).
A programme ranking sites on vegetation indices alone would put Harran first and Inner Mongolia fourth. The water balance reverses that ordering.
Every chip was scored against two independent products, LGRIP30 and GMIE-100. WorldCereal's irrigated label holds up reasonably at 3 of 4 sites (74–97% agreement).
Its non-irrigated label does not: 0 of 100 such chips at Harran are confirmed by either source. This is our measured answer to "why not just use WorldCereal" — it is partly trustworthy, quantified rather than assumed, and weakest exactly where it matters.
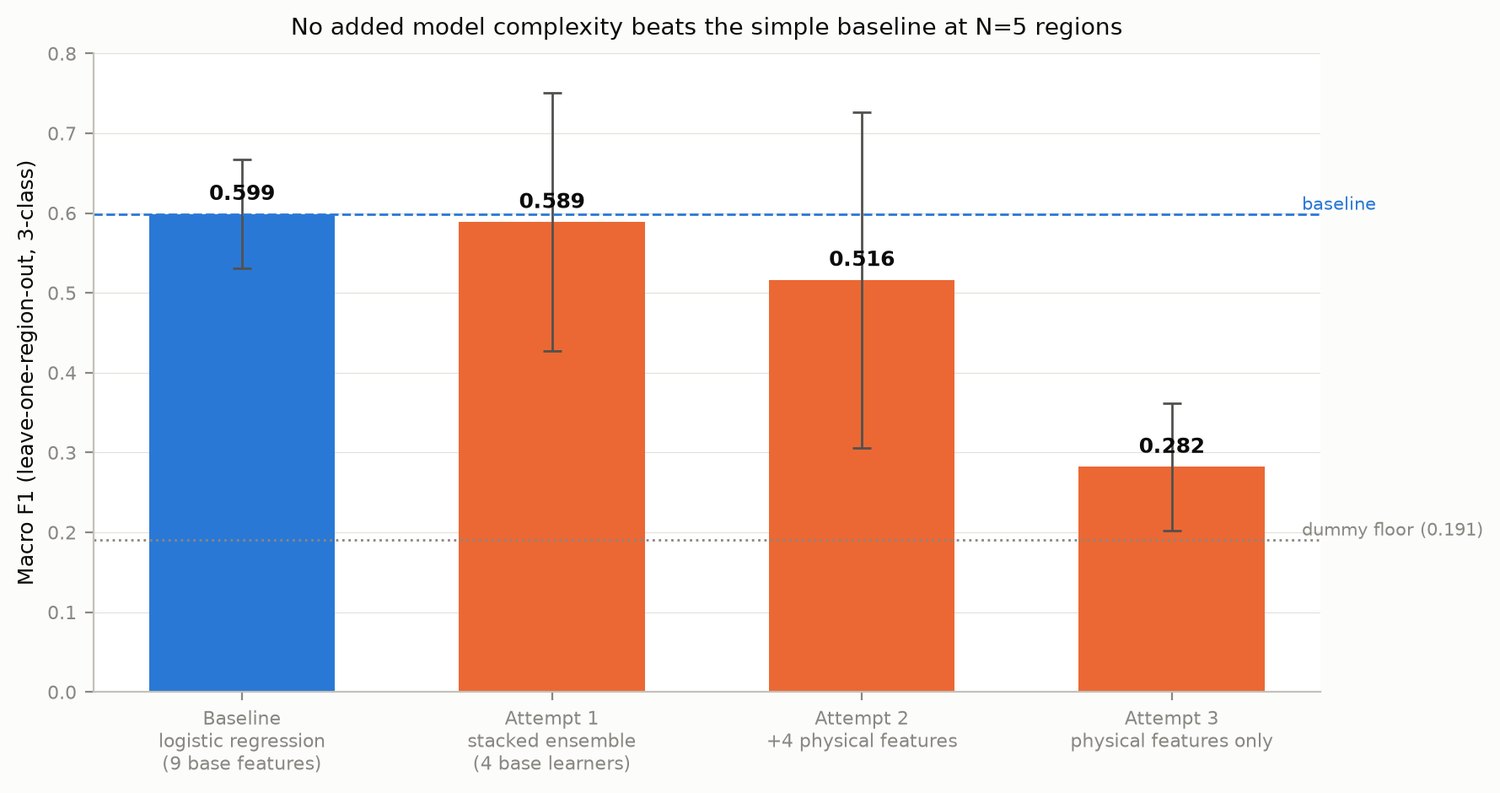
Four principled attempts to beat a 9-feature logistic regression all failed: a stacked ensemble, physically-motivated features, and sequence models (1D CNN, LSTM, GRU) on raw monthly series.
The sharpest evidence: chip-level training has ~140× more rows than region-level and scores lower (0.522 against 0.599) on an identical protocol. More samples inside the same five regions cannot substitute for more regions.
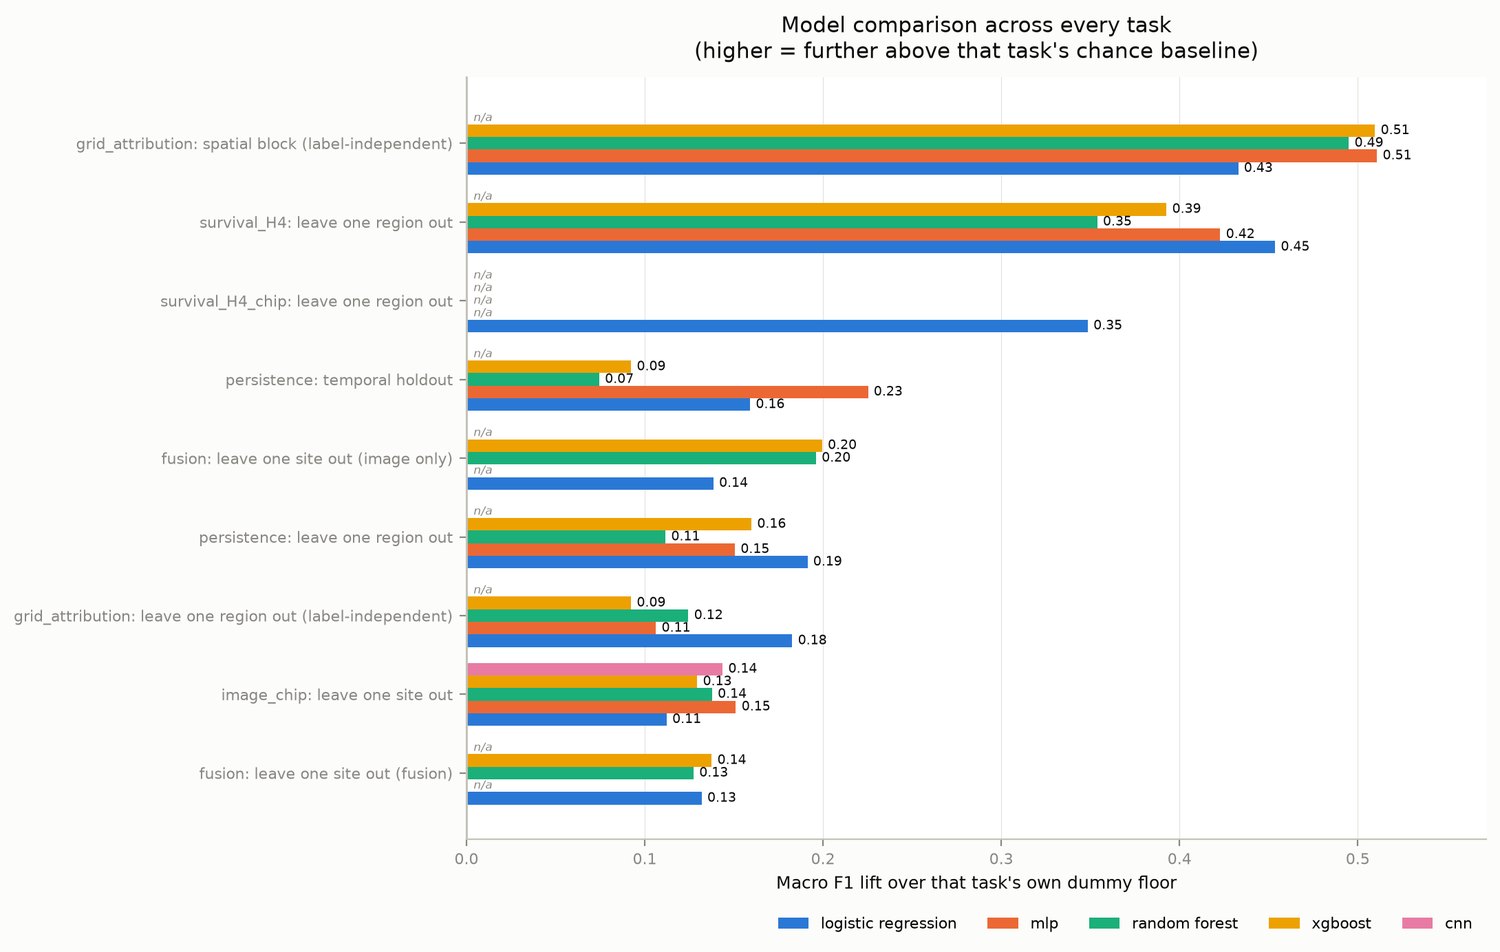
Every task is scored against its own majority-class dummy floor, and reported as lift above that floor. Raw macro-F1 is not comparable across tasks with different class counts and balances.
| Task | Protocol | Dummy F1 | Best model | Lift over floor |
|---|---|---|---|---|
| Grid-cell attribution (H1–H3) | Spatial block | 0.250 | MLP — 0.760 | 0.511 |
| Survival (H4), region-level | Leave-one-region-out | 0.136 | Logistic reg. — 0.589 | 0.454 |
| Survival (H4), chip-level | Leave-one-region-out | 0.174 | Logistic reg. — 0.522 | 0.349 |
| Persistence | Temporal holdout | 0.426 | MLP — 0.651 | 0.225 |
| Fusion, image-only arm | Leave-one-site-out | 0.333 | XGBoost — 0.533 | 0.199 |
| Persistence | Leave-one-region-out | 0.408 | Logistic reg. — 0.599 | 0.191 |
| Grid-cell attribution (H1–H3) | Leave-one-region-out | 0.266 | Logistic reg. — 0.449 | 0.183 |
| Image chip classifier | Leave-one-site-out | 0.333 | MLP — 0.484 | 0.151 |
Each figure is rebuilt from the saved per-fold result files rather than from numbers copied into prose, so it cannot drift from the results it claims to show.
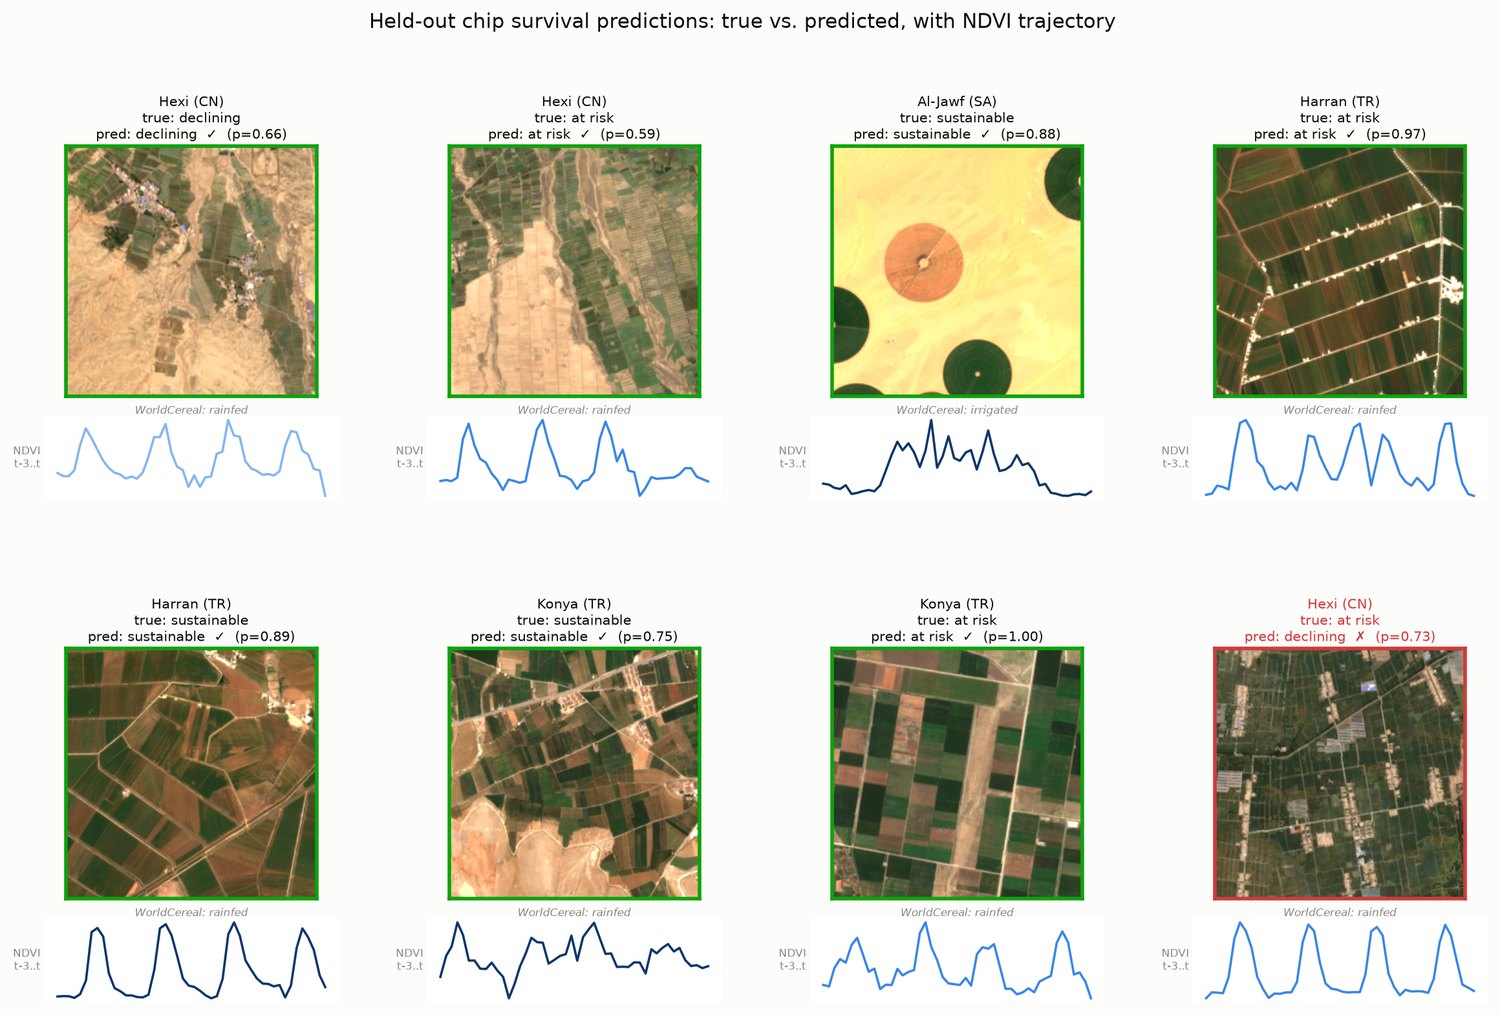
survival_level, and the NDVI trajectory each call rests on. One misclassification is included deliberately: a panel of only correct predictions would misrepresent a model at 0.60 accuracy.
Everything rebuilds from an empty clone and an Earth Engine account. No data is committed: it is all regenerated by the scripts.
.env.example to .env and set your Google Cloud project id.git clone https://github.com/yasinnerten/dryland-survival-ai
cd dryland-survival-ai
python -m venv .venv && source .venv/bin/activate
pip install -r requirements.txt
cp .env.example .env # then set PROJECT_ID
Full instructions, including every environment variable and the order the scripts run in, are in the README and DATA_COLLECTION.md.
Every label is a weak, rule-based proxy, so accuracy measures agreement with a rule rather than independent validation. At five regions, every macro-F1 is method validation rather than a powered claim.
GRACE's ~55 km footprint cannot resolve field-scale irrigation, which is why survival_level stops at an ordinal risk tier instead of forecasting remaining years. Inner Mongolia and Harran boundaries are literature-approximated rather than surveyed. All results are correlational, never causal.
Labeling a place "sustainable" or "irrigation-dependent" from orbit can mischaracterize a national restoration programme or a farming community without ground checks. We treat every output as a screening indicator, not policy evidence.